
This is a quick post about how to get the most out of Power BI (Fabric) model performance, keeping those models under control, refresh times low and live dashboard snappy. In this post I am going to focus on the data sources and efficiently loading data.
Power Query and M can do everything!
While Power Query and its underlying M language is great and can do so much, as with anything, that does not mean you should use it for everything.
I imagine most Power Query users at some point reduce the data that is in their model. This might be with filters on certain columns to reduce the rows, or by completely deleting unused columns. This makes sense and if you are not doing this, start doing it right now. Those eagle eyed of you however may have noticed that this does not always reduce the number of rows that are initially loaded and as such your model refreshes still take a long time. This is because your steps may be forcing all the data to get loaded into Power Query before these steps are applied. You may find that sometimes it does improve the load times and you are not sure why.
Using SQL queries as data sources
A way to improve load times of your model is to potentially reduce the result set up front by using a SQL query as your data source. This is not wholly a bad idea, however it can quickly become more painful than it first seems depending on the scale of your activities.
Doing this represents another piece of custom code that needs to be managed, and dare I say source and change controlled. Even if you put the code in a stored procedure or view to ensure that the code is managed in your data platform, the above still applies. This assumes you have permissions on the data platform to do this in the first place.
Perhaps equally as important is that doing this removes the ability for Power Query to perform Query Folding for you (there are workarounds, but this will be true for most). If your power query only has the single source load step, then this might not be a problem, but just because that is the case now, doesn’t mean it will be in the future.
Short version, use tables, not queries… yes even if the query is “SELECT * FROM myTable).
What is Query Folding?
The short version is, Power Query taking the steps you created and “folding” them into a single efficient SQL query, reducing the rows you have to import and pushing back processing on to the most likely, more efficient database platform.
You can read more about this here: Understanding query evaluation and query folding in Power Query – Power Query | Microsoft Learn
How do I know when query folding is happening?
This is actually really easy. For each step in your ‘applied steps’ section in Power query, there are some icons/indicators.
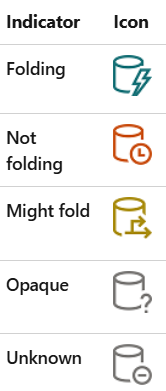
You want to see as much of the top icon as possible, however the image was taken from the following link and contains a much more detailed explanation of the indicators: Query folding indicators in Power Query – Power Query | Microsoft Learn
Further to the indicators, you can right click on a step and open the Query Plan for it. Here you can see the plan for that step giving a more detailed view of the parts that are folding with the remote tag, and you can even see the query that is being run. More on the query plan here: Query plan – Power Query | Microsoft Learn
Order Matters
As soon as a step cannot fold, all following steps will not fold (technically this is not exactly true, but is a good rule to follow for simplicity sake). This presents an opportunity to, where not fundamental to your transformations, get as much folding done before the non-foldable step(s).
Order also matters literally. For example (shamelessly taken from the MS link above), if you use LastN, there is no BOTTOM in SQL, but there is a TOP, so instead consider changing the order of the data and use TopN. Sounds obvious, but only if you are aware of what query folding is.
What will fold?
The easiest way to think about all this is, what is possible in the data source. Things like filtering (where clause), removing columns (select), some basic calculations (multiply a column by 10) will generally fold on a SQL database source for example.
While this is true, there is a level of complication involved. Just because you might be able to do it in SQL, doesn’t mean that Power Query will know how to, so another good rule is to keep the applied steps as simple as possible for as long as possible, especially those that reduce the size of the data set.
While you may not have much influence over this, a simple dimensional model can also make this easier as it will naturally lean towards your power query steps being simple.
Deliberate
As you have probably gathered, there is a lot of information on query folding. It can get complex. What I hope to have provided is a short introduction to get you started and ultimately promote awareness so that you can deliberately use it in the future.